Note
Go to the end to download the full example code.
Adding a custom tool to the existing toolbar
extra_js inlines a caller-supplied JS string into the page, run after
plotpress’s own – so window.plotpressAddTool and plotpressGetMarkers
already exist by the time it does. Two custom tools below:
Measure joins the toolbar as a real mode (
mode: 'measure'), selecting/deselecting alongside Axis Span/Axis Zoom/Point Picking the same as any built-in tool – picking it deselects whatever else was active, and picking something else deselects it. Two clicks on the same axes draw a line between them and label it with the distance in data units, viawindow.plotpressToData– the same per-axes pixel-to-data conversion (log-scale/inverted-axis-aware) Point Picking itself uses internally, exposed so a custom tool doesn’t have to reimplement it.Log Markers is a plain action button (no
modeat all) – it fires immediately on click, the same as the built-in Extract/Save buttons, without joining the selection group or changing the cursor.
Running this script writes a real, self-contained HTML file with both tools live in the toolbar – open it and try Measure on the curve below.
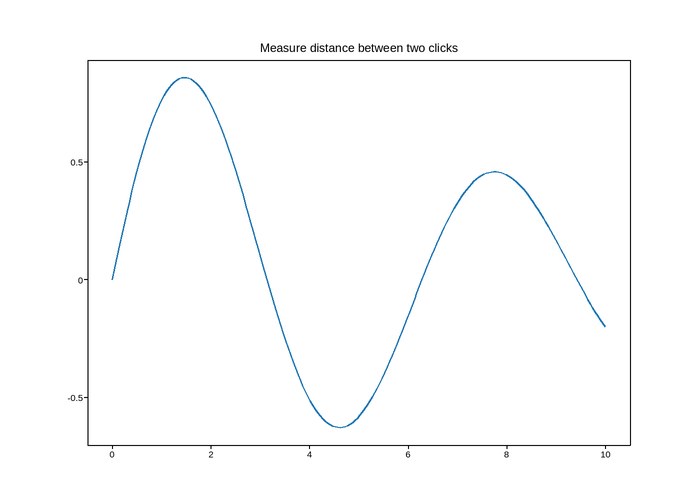
Live figure — pick a tool, then zoom, pan, point-pick or annotate. Nothing is active until a tool is selected.
View this figure’s Vega export ↗ — the raw JSON spec, rendered live by a real Vega engine.
View this figure’s Vega-Lite export ↗ — the raw JSON spec(s), rendered live by a real Vega-Lite engine.
import os
import tempfile

import numpy as np
import plotpress

fig, ax = plotpress.subplots(figsize=(7, 5))
x = np.linspace(0, 10, 200)
ax.plot(x, np.sin(x) * np.exp(-0.1 * x))
ax.set_title("Measure distance between two clicks")

extra_js = """
(function () {
  var startPt = null;

  function onMeasureClick(ev, p) {
    if (!startPt) { startPt = p; return; }          // first click: anchor
    var d0 = window.plotpressToData(startPt), d1 = window.plotpressToData(p);
    if (d0 && d1 && d0.axes === d1.axes) {           // second click: measure
      var dist = Math.hypot(d1.x - d0.x, d1.y - d0.y);
      var svg = document.getElementById('plotpress-svg');
      var ns = 'http://www.w3.org/2000/svg';
      var line = document.createElementNS(ns, 'line');
      line.setAttribute('x1', startPt.x); line.setAttribute('y1', startPt.y);
      line.setAttribute('x2', p.x); line.setAttribute('y2', p.y);
      line.setAttribute('stroke', '#d62728'); line.setAttribute('stroke-width', 2);
      svg.appendChild(line);
      var label = document.createElementNS(ns, 'text');
      label.setAttribute('x', (startPt.x + p.x) / 2);
      label.setAttribute('y', (startPt.y + p.y) / 2 - 6);
      label.setAttribute('fill', '#d62728');
      label.setAttribute('font-size', 12);
      label.setAttribute('font-weight', 'bold');
      label.textContent = 'd=' + dist.toFixed(3);
      svg.appendChild(label);
    }
    startPt = null;
  }

  window.plotpressAddTool({
    label: 'Measure', mode: 'measure', cursor: 'crosshair',
    onClick: onMeasureClick,
    onExit: function () { startPt = null; },   // discard a half-finished measurement
  });

  window.plotpressAddTool({
    label: 'Log Markers',
    onClick: function () {
      console.log('markers so far:', window.plotpressGetMarkers().length);
    },
  });
})();
"""

path = os.path.join(tempfile.gettempdir(), "plotpress_gallery_measure_tool.html")
fig.save(path, interactive=True, extra_js=extra_js)
Total running time of the script: (0 minutes 0.058 seconds)