Note
Go to the end to download the full example code.
Build a template once, reuse it across two different datasets
A figure layout can take real effort to get right – a dashboard’s panel
ids, spine colors, a shared group box, a twin axis for a second unit – and
that effort is wasted if it has to be rebuilt by hand every time a new
dataset needs the same treatment. plotpress.Figure.to_template()/
save_template() snapshot everything about that
structure and styling – each panel’s own id, distinct spine colors per
side, a twinx() overlay, and more – with no plotted data in it at
all, unlike plotpress.load_data()’s HTML round-trip (see
Reloading data from a saved HTML), which needs an actual saved, plotted figure
to read back. A template needs no HTML export, no interactive payload, and
no data ever having been plotted at all – just a blank, decorated figure
and a call to save_template(), producing a plain
.json file with nothing but structure and style in it.
plotpress.load_template()/plotpress.figure_from_template() read
it back and rebuild that same blank, fully-styled figure, ready to plot
fresh data into – the identical reconstruction function the HTML
round-trip itself uses once it has real data to replot alongside it.
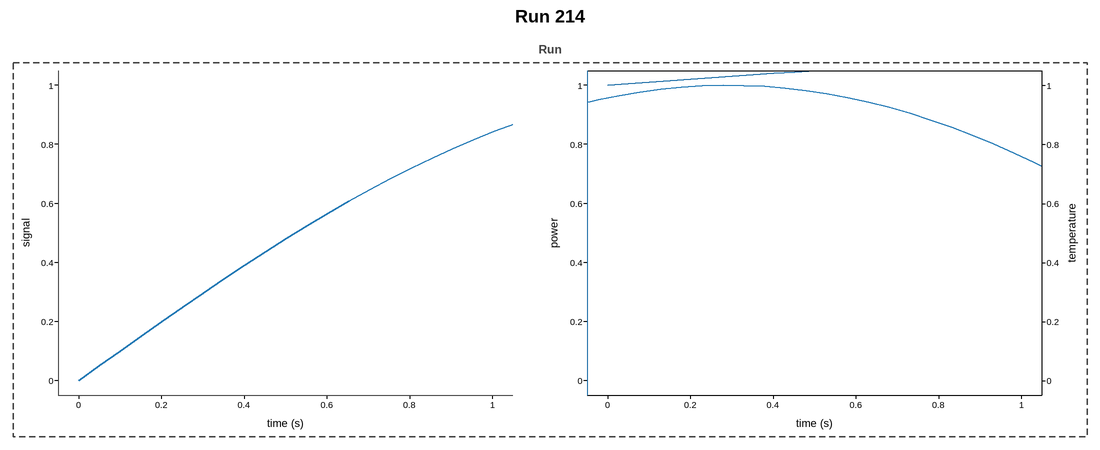
Live figure — pick a tool, then zoom, pan, point-pick or annotate. Nothing is active until a tool is selected.
View this figure’s Vega export ↗ — the raw JSON spec, rendered live by a real Vega engine.
View this figure’s Vega-Lite export ↗ — the raw JSON spec(s), rendered live by a real Vega-Lite engine.
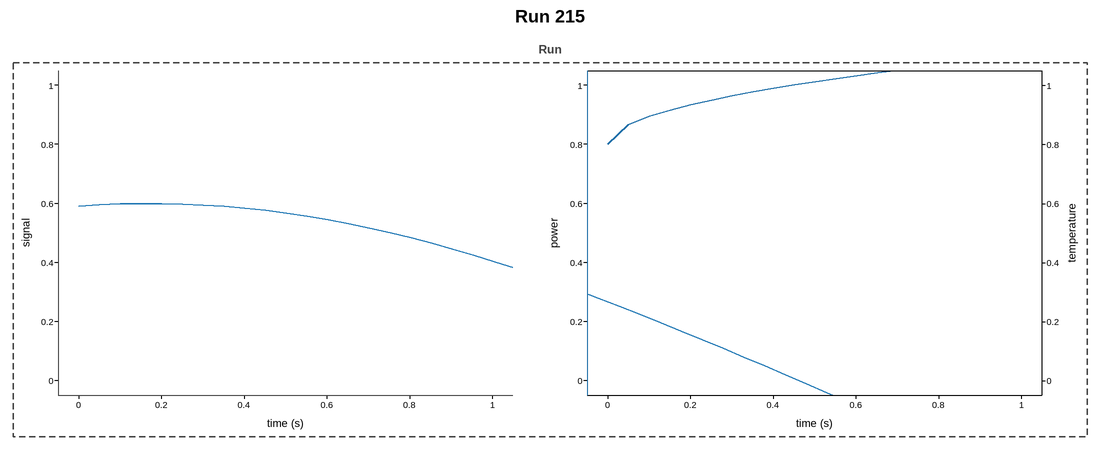
Live figure — pick a tool, then zoom, pan, point-pick or annotate. Nothing is active until a tool is selected.
View this figure’s Vega export ↗ — the raw JSON spec, rendered live by a real Vega engine.
View this figure’s Vega-Lite export ↗ — the raw JSON spec(s), rendered live by a real Vega-Lite engine.
import os
import tempfile

import numpy as np
import plotpress


def _build_template():
    """A two-panel run dashboard -- a primary trace on the left, a rate
    with its own twin temperature axis on the right -- built once and
    saved as a standalone JSON template."""
    fig, axes = plotpress.subplots(1, 2, figsize=(11, 4.5))
    axes[0].set_id("trace")
    axes[0].set_xlabel("time (s)")
    axes[0].set_ylabel("signal")
    axes[0].spines[:].set_color("#444444")
    axes[0].spines["top"].set_visible(False)
    axes[0].spines["right"].set_visible(False)

    axes[1].set_id("rate")
    axes[1].set_xlabel("time (s)")
    axes[1].set_ylabel("power")
    axes[1].spines["left"].set_color("#1f6fa8")
    twin = axes[1].twinx()
    twin.set_id("rate_temperature")
    twin.set_ylabel("temperature")
    twin.spines["right"].set_color("#b8003a")

    fig.group("Run", [axes[0], axes[1]], id="run", color="#444444", pad=8.0)
    fig.tight_layout()
    path = os.path.join(tempfile.gettempdir(), "plotpress_gallery_template.json")
    fig.save_template(path)
    return path


template = plotpress.load_template(_build_template())

# ---------------------------------------------------------------------------
# Reuse the identical template for two unrelated runs -- same panel ids,
# spine colors, twin axis, and group box both times, none of it re-declared.
# ---------------------------------------------------------------------------
t = np.linspace(0, 10, 200)

fig1, axes1 = plotpress.figure_from_template(template)
fig1.get_ax(id="trace").plot(t, np.sin(t), color="C0")
fig1.get_ax(id="rate").plot(t, 1.0 + 0.1 * t, color="#1f6fa8")
fig1.get_ax(id="rate_temperature").plot(t, 20 + 3 * np.sin(t / 2), color="#b8003a")
fig1.suptitle("Run 214")
fig1.tight_layout()

fig2, axes2 = plotpress.figure_from_template(template)
fig2.get_ax(id="trace").plot(t, np.sin(t + 1.4) * 0.6, color="C0")
fig2.get_ax(id="rate").plot(t, 0.8 + 0.3 * np.sqrt(t), color="#1f6fa8")
fig2.get_ax(id="rate_temperature").plot(t, 18 + 5 * np.cos(t / 3), color="#b8003a")
fig2.suptitle("Run 215")
fig2.tight_layout()
Total running time of the script: (0 minutes 0.182 seconds)