Note
Go to the end to download the full example code.
Fitting and plotting across processes, from a lazy parquet scan
The parallel part here is genuinely CPU/I/O work, not axes construction:
each worker lazily scans a shared parquet file, filters to its own sensor,
collects to plain numpy arrays, fits a curve, and plots the result – onto
an axes it was handed, not one it invents. That axes is a copy the
moment it crosses back into this process (pickling a Python object across
a process boundary never preserves identity, however it looks), so
fig.adopt_axes() merges each one back into the real figure, in place
of whichever of its own axes shares that grid position.
The worker function itself has no branch for “am I in a subprocess or
not” – analyze_panel() below is identical either way. The debug call
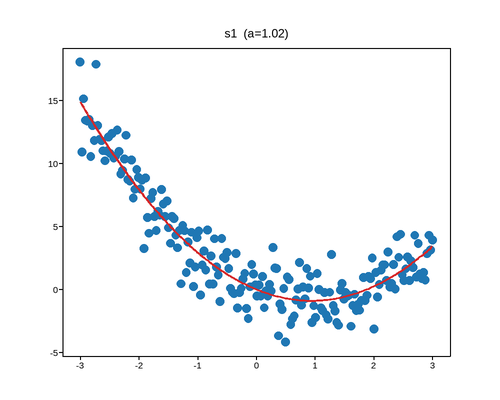
at the bottom hands it a real axes directly: no joblib, no
adopt_axes(), just a normal function call in this process – exactly
the kind of call worth making by hand while developing the fit itself,
before ever running it as a batch.
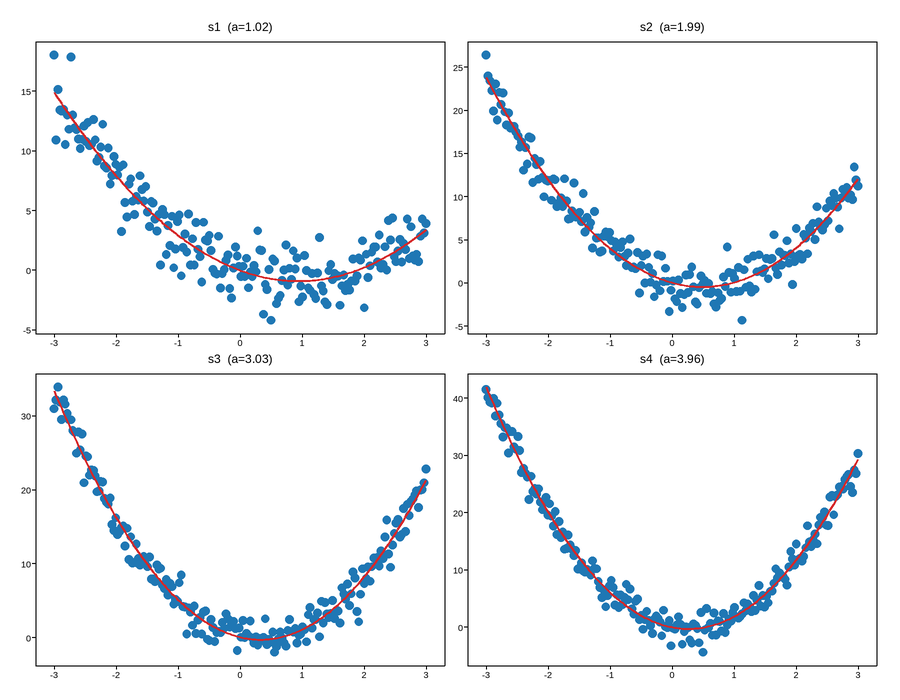
Live figure — pick a tool, then zoom, pan, point-pick or annotate. Nothing is active until a tool is selected.
View this figure’s Vega export ↗ — the raw JSON spec, rendered live by a real Vega engine.
View this figure’s Vega-Lite export ↗ — the raw JSON spec(s), rendered live by a real Vega-Lite engine.
Live figure — pick a tool, then zoom, pan, point-pick or annotate. Nothing is active until a tool is selected.
View this figure’s Vega export ↗ — the raw JSON spec, rendered live by a real Vega engine.
View this figure’s Vega-Lite export ↗ — the raw JSON spec(s), rendered live by a real Vega-Lite engine.
import os
import tempfile

import numpy as np
import polars as pl
from joblib import Parallel, delayed

import plotpress


def _write_source_parquet():
    """A long-format table of four sensors' noisy readings -- standing in
    for a dataset that would already exist on disk in practice."""
    rng = np.random.default_rng(3)
    sensors, curvatures = ["s1", "s2", "s3", "s4"], [1.0, 2.0, 3.0, 4.0]
    x = np.linspace(-3, 3, 200)
    tables = []
    for sensor, a in zip(sensors, curvatures):
        y = a * x**2 - 2 * x + rng.normal(scale=1.5, size=x.shape)
        tables.append(pl.DataFrame({"sensor": [sensor] * len(x), "x": x, "y": y}))
    path = os.path.join(tempfile.gettempdir(), "plotpress_gallery_readings.parquet")
    pl.concat(tables).write_parquet(path)
    return path


def analyze_panel(ax, path, sensor):
    """Lazily read one sensor's rows out of the parquet file, fit a
    quadratic, and plot both -- onto whichever axes it's given."""
    df = (pl.scan_parquet(path)
            .filter(pl.col("sensor") == sensor)
            .collect())
    x, y = df["x"].to_numpy(), df["y"].to_numpy()
    coeffs = np.polyfit(x, y, deg=2)
    ax.scatter(x, y, s=6, color="#1f77b4")
    ax.plot(x, np.polyval(coeffs, x), color="#d62728", linewidth=2)
    ax.set_title(f"{sensor}  (a={coeffs[0]:.2f})")
    return ax


path = _write_source_parquet()
fig, axes = plotpress.subplots(2, 2, figsize=(9, 7))

# One dict per panel: which axes it belongs on, plus everything
# analyze_panel needs -- fed to it as **kwargs, so the dict *is* the call.
panels = {
    sensor: {"ax": ax, "path": path, "sensor": sensor}
    for sensor, ax in zip(["s1", "s2", "s3", "s4"], axes.ravel())
}

built = Parallel(n_jobs=4)(delayed(analyze_panel)(**kw) for kw in panels.values())
for built_ax in built:
    fig.adopt_axes(built_ax)
fig.tight_layout()

# ---------------------------------------------------------------------------
# Debugging one panel later, live: the SAME function, called directly. No
# joblib, no adopt_axes() -- it plots straight onto this axes, in this
# process, because there was never a process boundary to cross in the
# first place.
# ---------------------------------------------------------------------------
dbg_fig, dbg_ax = plotpress.subplots(figsize=(5, 4))
analyze_panel(dbg_ax, path, "s1")
Total running time of the script: (0 minutes 0.289 seconds)