Note
Go to the end to download the full example code.
Frame slider, and exporting it as a GIF
ax.plot_frames(x, Y) plots 3-D data Y of shape (n_frames, n_points)
as a line with a play/pause/step slider over the extra dimension – the static
gallery image below captures frame 0; open the figure as interactive HTML to
scrub it.
The same frames also export straight to a self-contained looping GIF with
fig.save(path, fps=...), for anywhere an interactive slider does not fit
(a README, a slide, a chat message).
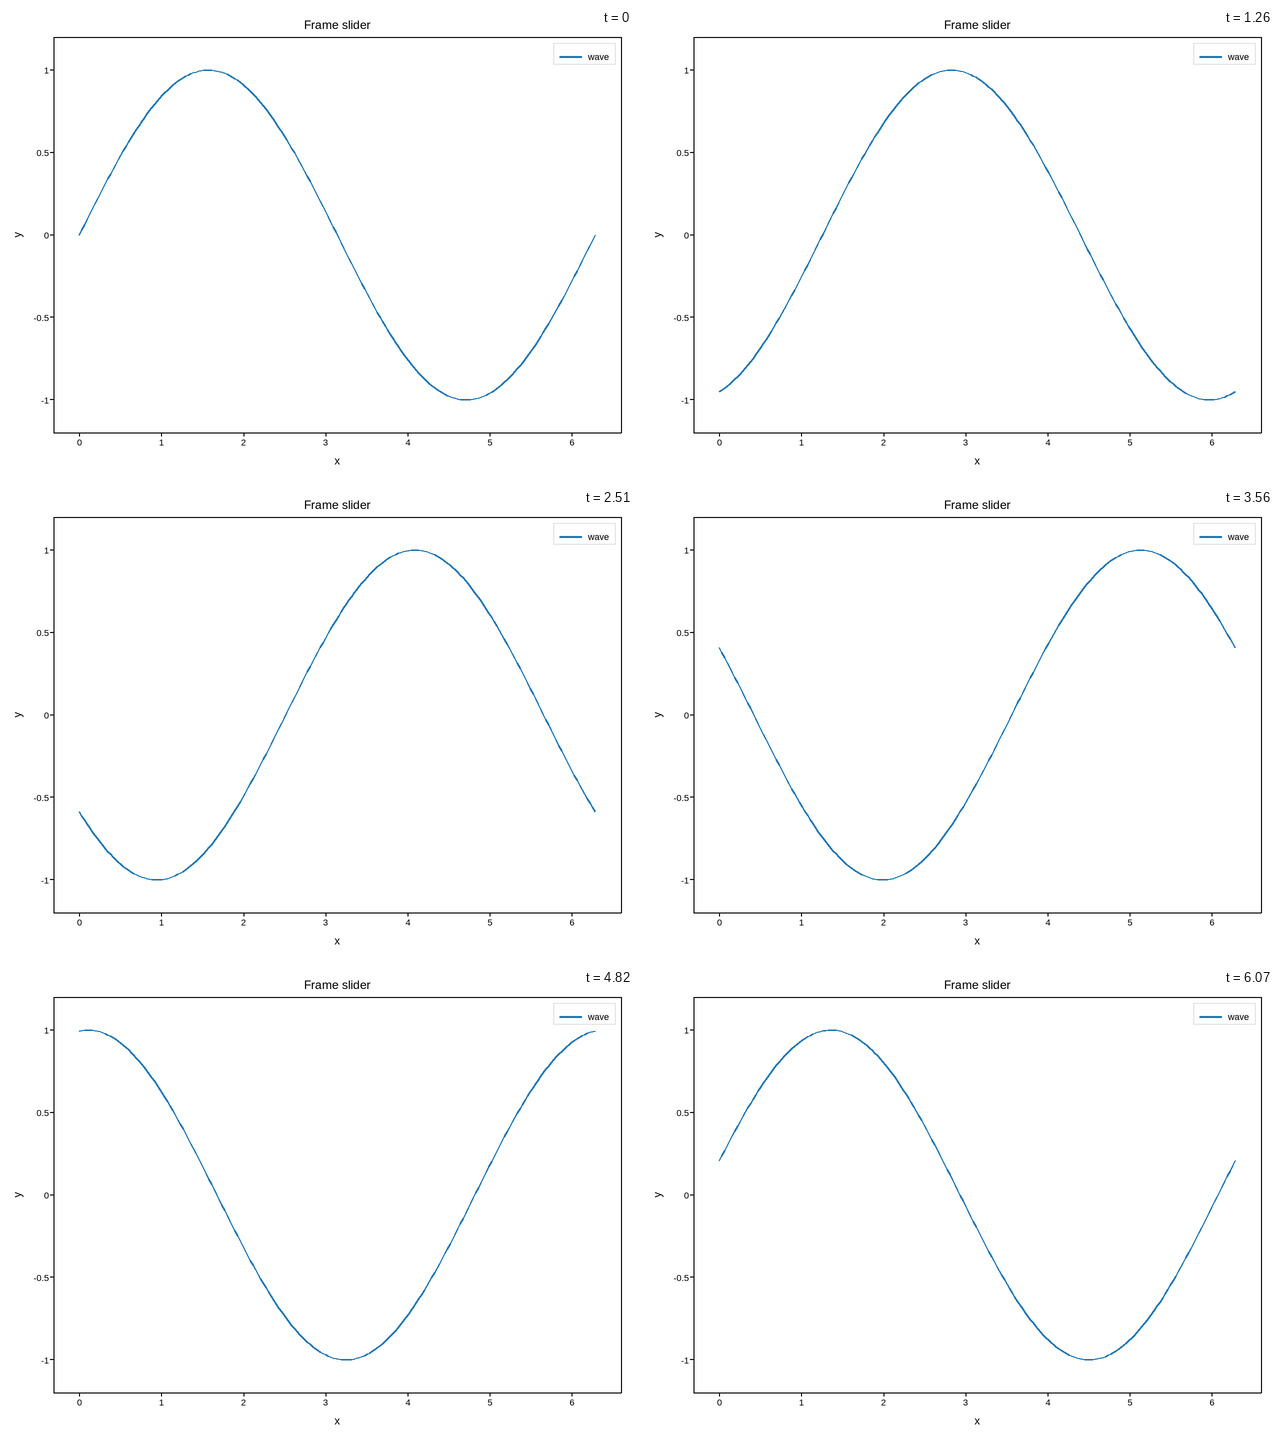
Live figure — pick a tool, then zoom, pan, point-pick or annotate. Nothing is active until a tool is selected.
import os
import tempfile

import numpy as np
import plotpress

x = np.linspace(0, 2 * np.pi, 200)
t = np.linspace(0, 2 * np.pi, 30, endpoint=False)
wave = np.sin(x[None, :] - t[:, None])          # (n_frames, n_points)

fig, ax = plotpress.subplots()
ax.plot_frames(x, wave, slider_values=t, slider_label="t", label="wave")
ax.set_xlabel("x"); ax.set_ylabel("y"); ax.set_title("Frame slider")
ax.set_ylim(-1.2, 1.2)
ax.legend()
fig.tight_layout()

gif_path = os.path.join(tempfile.gettempdir(), "plotpress_frame_slider.gif")
fig.save(gif_path, fps=15)
Total running time of the script: (0 minutes 4.367 seconds)